

How data can create tangible insights that can be used in real-world agricultural environments
The second part in this series exploring our software features IGS’ Head of Data, Emily Seward. Emily covers the role data plays in empowering IGS customers, and how it combines with the user interface to unlock new areas of growth.
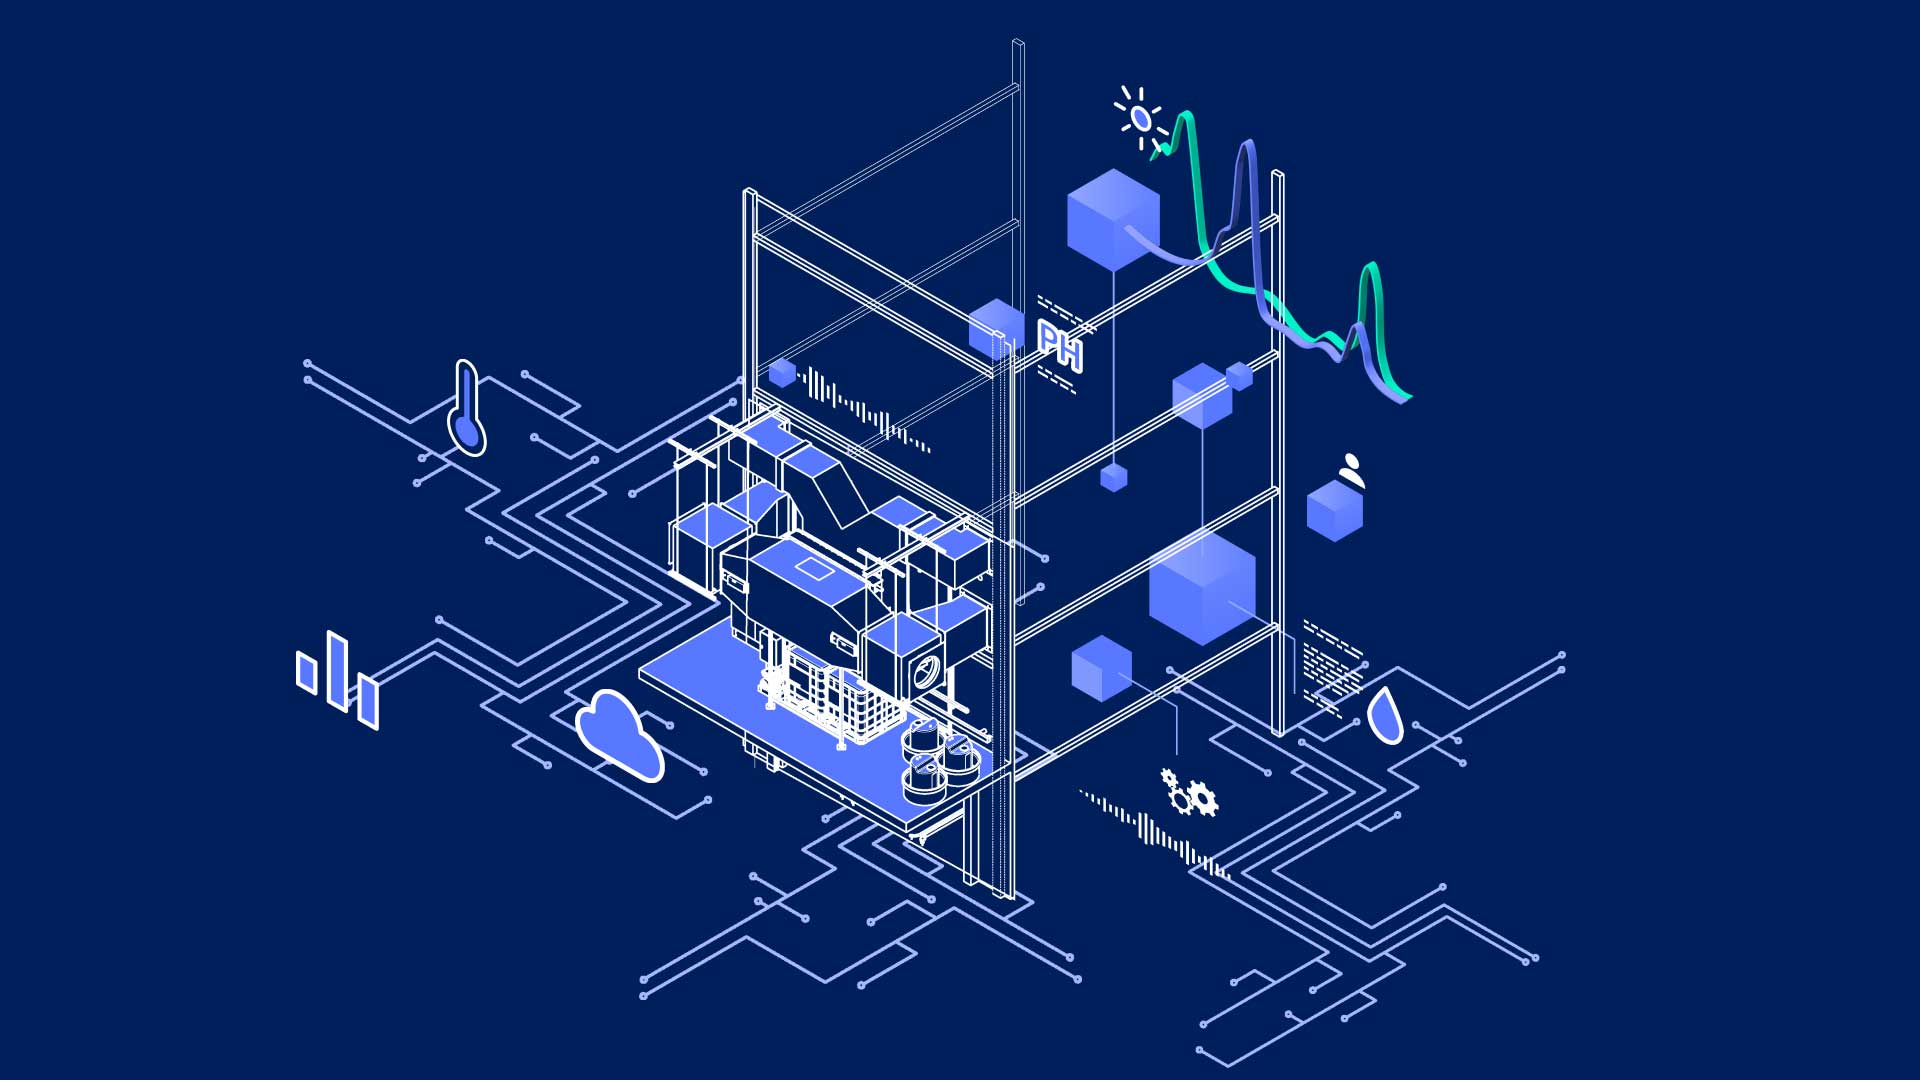
Vertical farming, and the complete precision that Total Controlled Environment Agriculture (TCEA) offers, provides growers with a vast number of variables that can be modified to alter crop growth, or improve operational efficiencies. These variables, such as light intensity or temperature, can be linked to crop outcomes including yield or morphology. We can then take data from this process, resulting in large, invaluable datasets. This helps us to achieve higher quality harvests, and improves overall site efficiency.
IGS leverages data generated by our Growth Towers to improve the intelligence of our system, ultimately making it easier for our customers to get the information they need to successfully grow crops. By enriching standard data streams with machine intelligence, we can generate observable insights, refine recipes to suit different crops and circumstances, and perform environmental health checks. Intelligent use of data is crucial here. Not only does it ensure a high performing system, but it will also be an increasingly critical part of how the agritech industry operates in the coming years.
Using visual imagery to showcase data
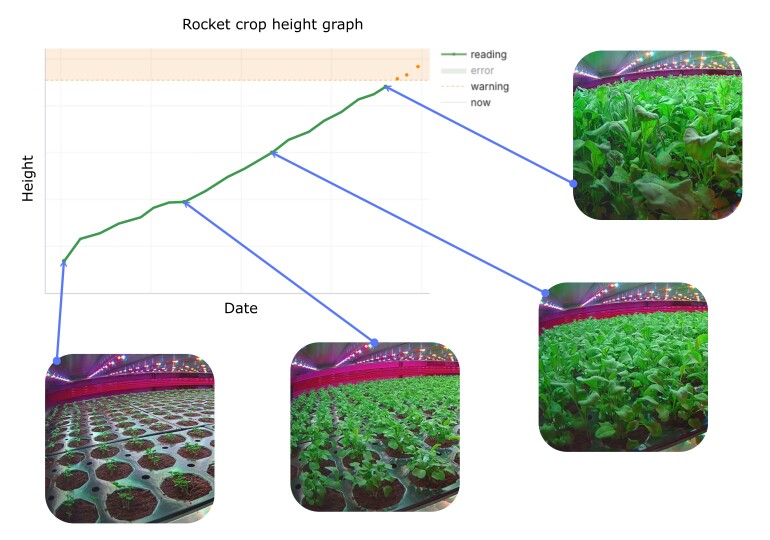
Growers can monitor the progress of their crops within our Growth Trays via cameras mounted on either side of the lift. These generate images – removing the need for crops to be taken out of our system for quality checks, and also containing a wealth of data that can be extracted to provide further insights.
Using the known dimensions of the Growth Tray and the surrounding tower structure, we can calibrate each camera to extract 3D metrics of the crop, like height or uniformity. Originally, this calibration process had to be performed manually, but we now utilise a machine learning model able to carry out feature recognition and extraction automatically, improving the frequency and standardisation of the calibrations. This results in faster, more consistent analysis, giving customers:
- more accurate crop height tracking
- easier detection of subtle differences between growth jobs
- a foundation for building new monitoring tools
- the ability to spot if any calibration changes
This automation removes the need for manual workflows, allowing us to scale up these solutions to more towers, sites, and customers.
What insights we can take from this
Automated image analysis allows us to track several variables and detect specific events, such as when a crop is reaching a height where it is at risk of damage. This data can also be used to reveal patterns during recipe development or trials. If a crop isn’t growing at the rate we’d expect, for example, it can be a sign that factors such as lighting, nutrient mix, or watering frequency need adjusting. This kind of feedback is key in helping our team of crop scientists to be agile, rapidly remedying any issues that might arise.
We’re also investigating how we apply predictive analysis based on growth curves, and the process of site-wide forecast models for harvest delivery. This work is still in the early stages, but we’re excited about its potential for integration into our software suite.
The crop segmentation tool
Another good example of how we translate imagery into tangible data would be our custom crop segmentation tool. This takes standard images from tower cameras and automatically segments the plants from the background in each image. The result allows us to focus on crop pixels, and monitor factors like plant health, coverage and development. This becomes much simpler as we can effectively isolate the plants from any other noise, giving growers access to tangible datapoints on what matters most – the plants.
Supporting data-driven crop recipe development and refinement
Data is important to both scientists and operators, shaping the way our customers explore and execute growth recipes. We record datapoints in every Growth Job, including lighting schedules, irrigation, environmental conditions, and what crop outcomes were achieved under these conditions. The combination of this data is a centralised logbook, storing a huge amount of information which we can share with our customers, and also use to implement improvements to our product. We can compare datapoints across different growth cycles, seeing the impact certain changes can have over a set period.
Using data for environmental health checks
To maintain a controlled environment, our software constantly observes and integrates readings from a network of sensors across the towers, giving live feedback on key variables like:
- tower temperature
- humidity levels
- water pH
- water electrical conductivity (EC)
- tower CO2 concentration
Complex control loops keep environmental conditions within the defined setpoint ranges, and we can monitor the interaction between these variables to paint a more detailed picture of the current environment in the towers. IGS teams have access to augmented diagnostic data, enabling us to gain a deeper understanding of our technology and its impact on crops. This continuous feedback loop helps to maintain each Growth Tower’s microclimate at an optimal level, while supporting healthy, predictable plant growth.
The role that data can play in the future of farming
As the agritech industry evolves further, we see data playing an even greater role in influencing how the workforce uses technology in day-to-day operations. Our platform is positioned to lead that shift. It works to embed various degrees of automation, not as a way of replacing people, but of freeing them from repetitive, manual inspections so that they can focus on creative, higher-value tasks.
The data we collect can be implemented in advanced analytics, working to feed machine learning or AI models which can then deliver even more powerful insights. By ensuring that they have the right datapoints and are concentrating on the right metrics, we can put in place a data-rich approach which makes for a wholly more intelligent way of working.
This blog also features input from Stephen Blowers, Senior Data Scientist at IGS. Stephen works closely with Emily and the rest of the Data team, helping translate complex metrics into actionable insights for IGS customers.
Enjoy what you’ve read? Read more on Emily’s take on the future of artificial intelligence and vertical farming.
.jpg)
